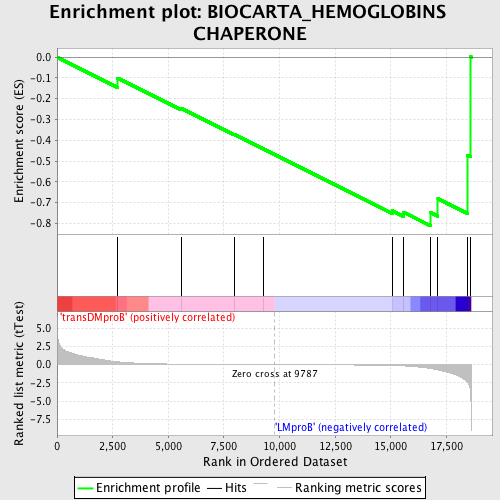
Profile of the Running ES Score & Positions of GeneSet Members on the Rank Ordered List
| Dataset | Set_04_transDMproB_versus_LMproB.phenotype_transDMproB_versus_LMproB.cls #transDMproB_versus_LMproB |
| Phenotype | phenotype_transDMproB_versus_LMproB.cls#transDMproB_versus_LMproB |
| Upregulated in class | LMproB |
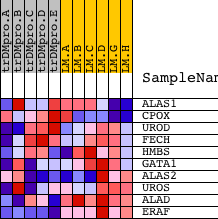
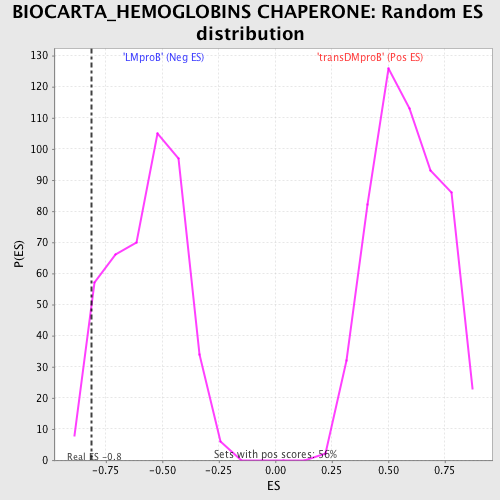
| GeneSet | BIOCARTA_HEMOGLOBINS CHAPERONE |
| Enrichment Score (ES) | -0.8125344 |
| Normalized Enrichment Score (NES) | -1.4358855 |
| Nominal p-value | 0.049661398 |
| FDR q-value | 1.0 |
| FWER p-Value | 1.0 |
| PROBE | DESCRIPTION (from dataset) | GENE SYMBOL | GENE_TITLE | RANK IN GENE LIST | RANK METRIC SCORE | RUNNING ES | CORE ENRICHMENT | |
|---|---|---|---|---|---|---|---|---|
| 1 | ALAS1 | 19013 | 2723 | 0.386 | -0.1008 | No | ||
| 2 | CPOX | 1740 8780 | 5580 | 0.065 | -0.2466 | No | ||
| 3 | UROD | 15791 | 7951 | 0.020 | -0.3715 | No | ||
| 4 | FECH | 1975 23419 1964 | 9271 | 0.006 | -0.4418 | No | ||
| 5 | HMBS | 19149 3004 49 | 15066 | -0.116 | -0.7394 | No | ||
| 6 | GATA1 | 24196 | 15583 | -0.170 | -0.7471 | No | ||
| 7 | ALAS2 | 24229 | 16801 | -0.536 | -0.7492 | Yes | ||
| 8 | UROS | 17588 1227 | 17118 | -0.719 | -0.6812 | Yes | ||
| 9 | ALAD | 15866 | 18442 | -2.376 | -0.4717 | Yes | ||
| 10 | ERAF | 5034 | 18593 | -4.072 | 0.0012 | Yes |